Statistical tools provide instructors with a snapshot of where students are at any given time. The tools provided in Brightspace will give instructors the ability to gauge whether students are meeting learning outcomes. This document will offer a detailed walkthrough of the Content tool. However, you can only see the statistics and report for each content topic. For an overview of your students’ progress, please use the Class Progress Tool instead.
Content
1. View Completion Tracking Results for a Topic
Each content topic contains a Completion Summary that tracks student completion results. The types of completion results depend on the type of topic. For example, completion tracking results for an assignment folder indicate whether a student has submitted anything, while results for a file topic indicate whether a student has viewed the topic or not. Follow the below steps to access the completion tracking results for a topic.
Step 1: From the content tab, navigate to the module that contains the topic you want to view completion tracking results for, then click on the topic.


Step 2: Beneath the content of the topic (at the bottom of the page), select the Completion Summary tab.
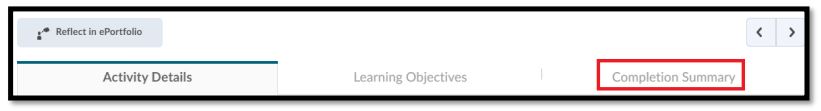
Each topic contains a Completion Summary that tracks student completion results. In this example, the topic is file content, so the Completion Summary indicates whether a learner has viewed the topic or not.
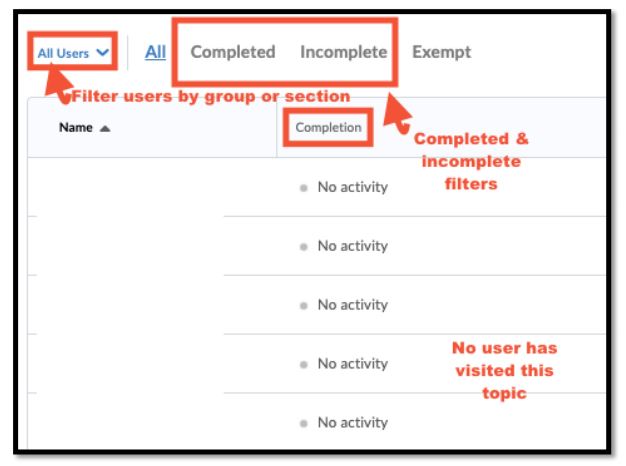
In addition to the existing “Completed” and “Incomplete” filters, you can also filter users in the Completion Summary by the groups or sections you created within your course.
2. View Reports of a Content Item
You can find more detailed statistics through the Table of Contents. It will reveal how many users have visited a topic as well as the time spent on it. Additionally, you can get a detailed report of each learner, when they last visited the content, how many times they visited, total time spent, and average time spent. Follow the below steps to view Reports for content in your course.
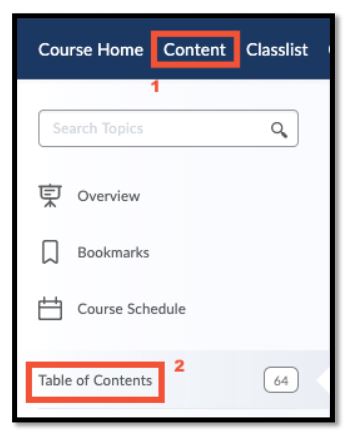
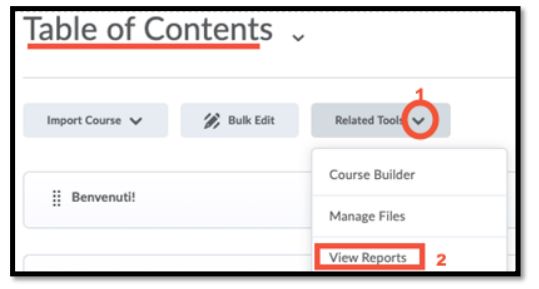
Step 1:From the Content page, select Table of Contents.
Step 2:From the Related Tools drop-down menu, select View Reports.
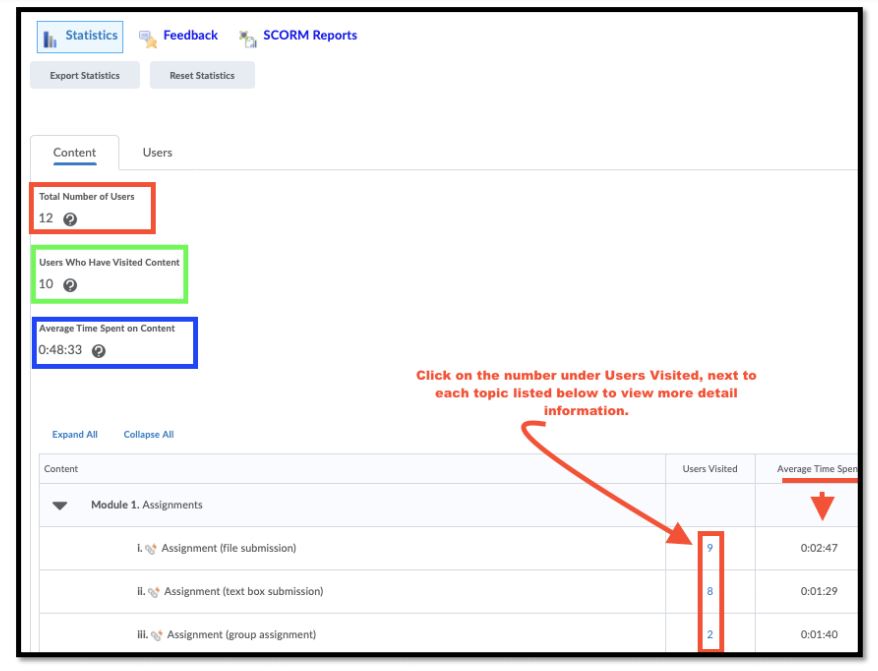
Information about the entire course will be displayed at the top including the total number of users, the number of those users who have visited content, and the average time spent on content for the entire course.
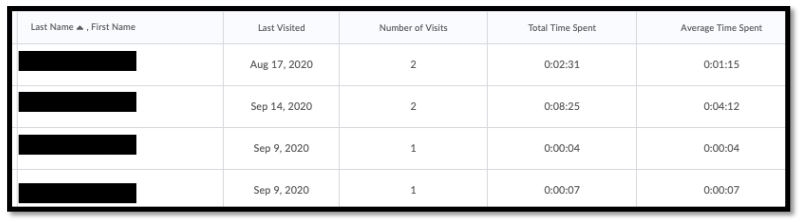
Step 3:Click on the number in the Users Visited column to see a detailed view of a topic.
A detailed view of each learner’s interaction with the topic will be displayed in a table. On this tab, you can see the last time someone accessed a specific topic, how many times, when, and for how long.