To access quiz statistics, navigate to Course Tools > Quizzes > Statistics.


1. Viewing quiz statistics
Follow the steps below to view more detailed statistics for a given quiz.
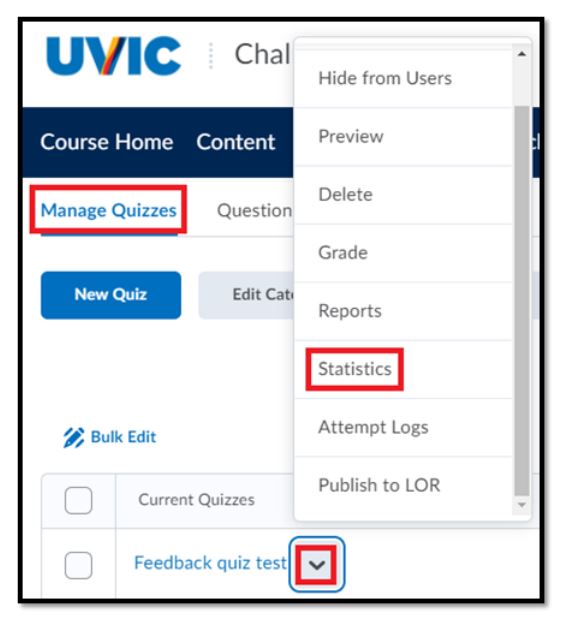
Step 1: On the Manage Quizzes tab, select Statistics from the drop-down menu of the quiz you want to view statistics for.
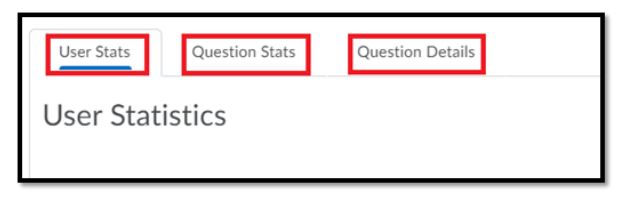
Step 2: On the View Statistics page, click either the User Stats, Question Stats, or Question Details tab to view statistics broken down by user and by question.
1.1. User Stats
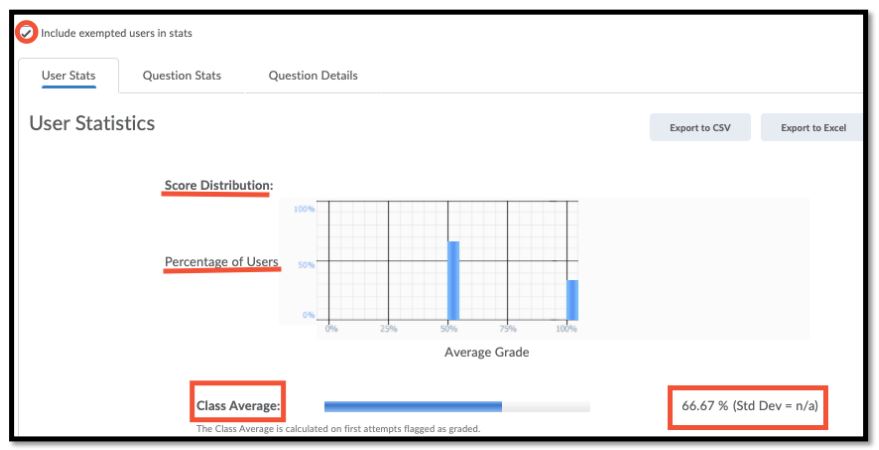

In the User Stats tab, there are several tools that will allow you to view how your class did on a particular quiz.
1. Score Distribution
2. Class Average
3. Show Search Options: To view a particular student’s statistics, you can search using the filters shown below.
4. Individual Scores.
1.2. Question Stats
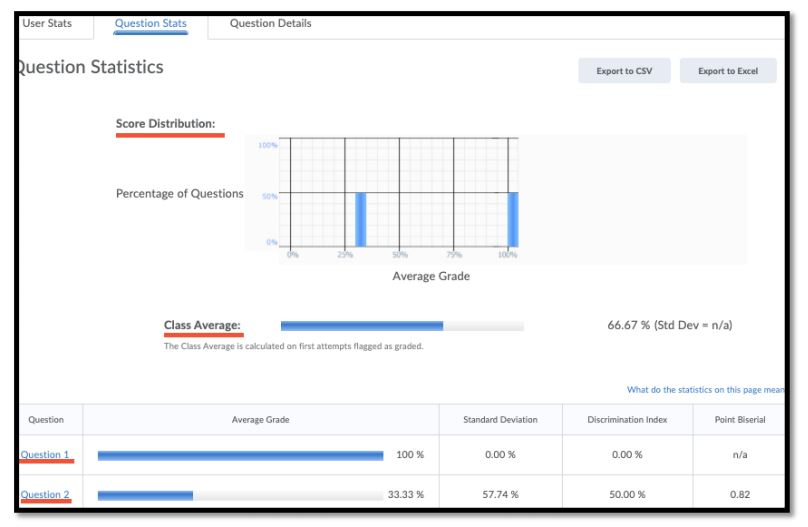
In the Question Stats tab, there are several tools an instructor can use to view how students did on each question.
1. Score distribution (distribution of the score based on the percentage of questions).
2. Class Average
3. Class Average per question
1.3. Question Details

Question Details shows the class average for each question in the quiz. It shows:
1. The question’s difficulty
2. What the question is and the correct answer
3. The Average Grade for the question
4. If there is any Standard Deviation (see 1.4.)
5. Any Point Biserial (see 1.4.)
6. Any Discrimination Index (see 1.4.)
This section allows instructors to see if there are key points or sections in their curriculum that students are struggling with.
1.4. What do the Statistics on this page mean?
All statistics are calculated based on each user’s first attempt at the quiz. If a question is changed after attempts have been made, only the attempts on the newest version of the question are included in the statistics (i.e. First attempts made before a question was changed are not included in the statistics for that question).
Standard Deviation
The standard deviation indicates how much scores vary from the average, ranging from 0% to 100%. A high standard deviation indicates that scores are spread out from the average, whereas a low standard deviation indicates that scores are close to the average.
Discrimination Index
The discrimination index indicates how well a question differentiates between high and low performers. It can range from -100% to 100%, with high values indicating a “good” question, and low values indicating a “bad” question.
Point Biserial Correlation Coefficient
The point biserial correlation coefficient is an analysis only applied to multiple-choice and true/false question types that have only one answer with weight 100%, and all others with weight 0%.
Similarly, to the discrimination index, the point biserial correlation coefficient relates individuals’ quiz scores to whether or not they got a question correct. It ranges from -1.00 to 1.00, with high values indicating a “good” question, and low values indicating a “bad” question.
Note that only first attempts with scores between 0% and 100% on a question are included in that question’s statistics.
1.5. Exporting Quiz Statistics
Select Export to CSV or Export to Excel within a tab to save the quiz’s statistics to your computer.
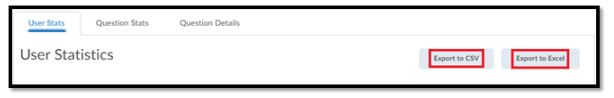
Note: The system will export the statistics of only the tab you are currently viewing. For more information on understanding exported quiz statistics, please see this resource.
2. Search Options
Within the grade setting of quizzes, there is a search option that allows you to search for different submission/grade options for a quiz.
Step 1: In Manage Quizzes, scroll to the quiz of interest and select Grade from the drop-down menu.
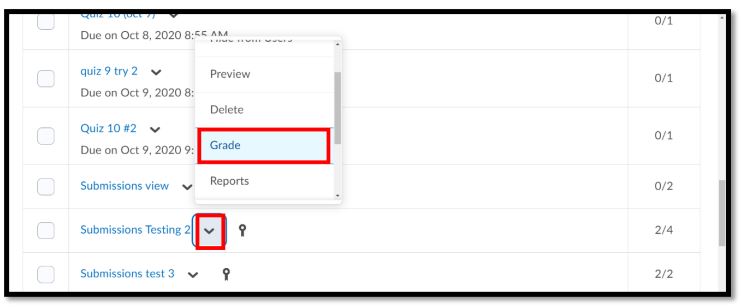
Step 2: Click Show Search Options, and then select the drop-down menu and choose the desired search filter from the drop-down menu that appears below.


In this example, we selected Users who have not taken an attempt. A list of users that meets that search criteria will appear towards the bottom of the page.

You can repeat the process within the Attempts tab with different search options.

